

All data lovers you are in luck!
Another quarter of data is in, courtesy of the CMS Research Data Assistance Center (ResDAC).
We have all watched trends since the initiation of the Patient Driven Payment Model (PDPM); been curious as to the impact of COVID-19; and will continue to ponder what may occur in FY 2023 with the delay seen in parity for FY 2022.
Remember the analysis of data and trending was clearly outlined Final Rule indicating where shifts have occurred and what the potential impacts may be.
Specifically, the Centers for Medicare & Medicaid Services stated it has determined, through budget neutrality analysis, that even absent COVID-related cases in 2020, i.e., active COVID dx. and or use of the 3-day stay waiver, there was a 5.0% increase in aggregate spending under the PDPM for FY 2020 due to the shift in case mix utilization, compared to FY 2019.
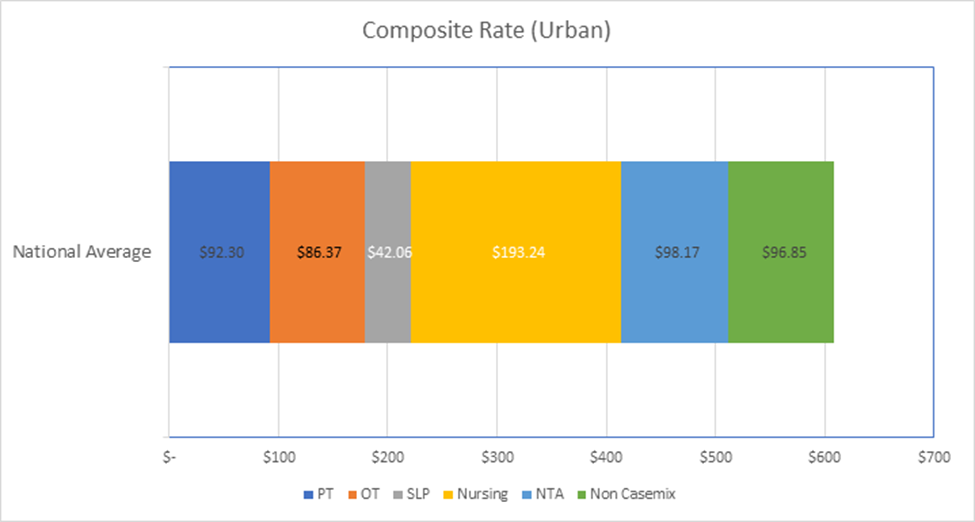
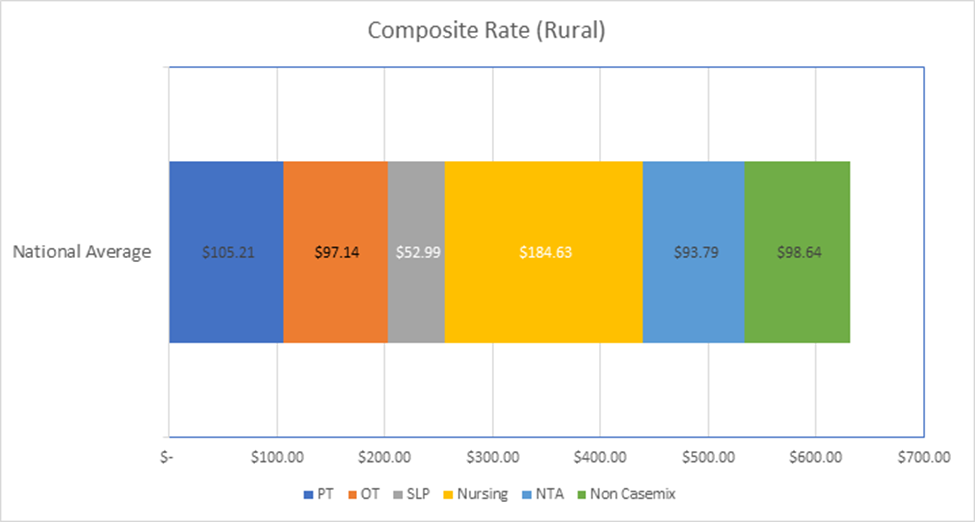
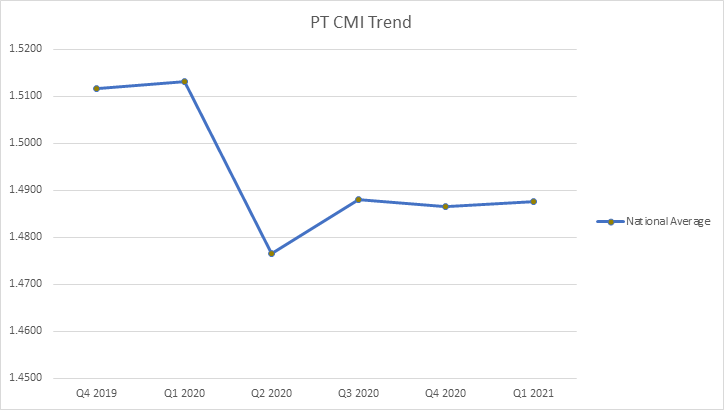
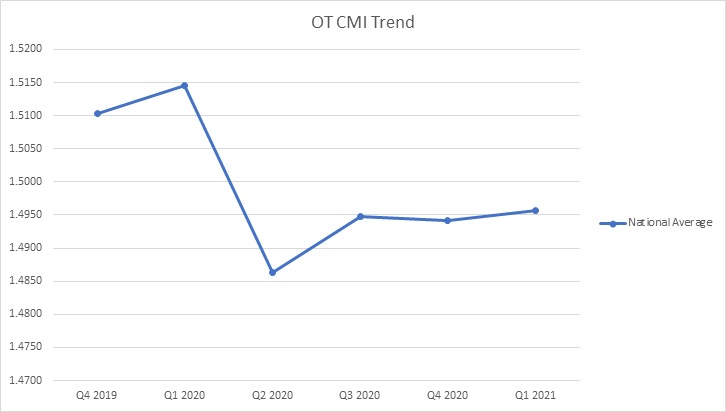
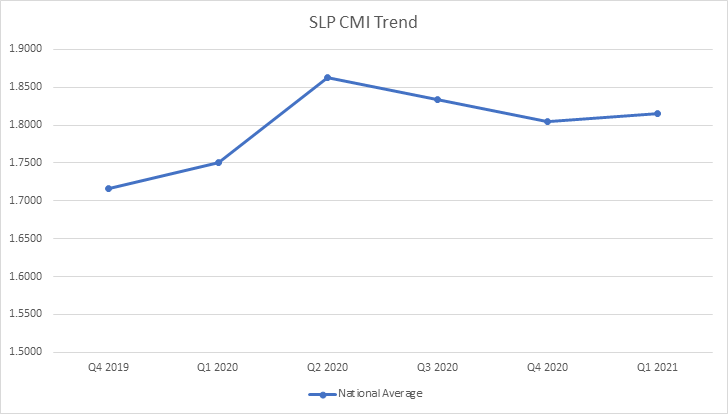
CMS observed slight decreases in the average CMI for the PT and OT rate components for skilled nursing facility populations as compared to what was expected, as well as significant increases in the average CMI for the SLP (22.6%), Nursing (16.8%), and NTA (5.6%) for FY 2020 populations as compared to what was expected, for FY 2020 SNF population.
CMS sees these significant increases in the average case-mix for these components as primarily responsible for the inadvertent increase in spending under PDPM.
The best advice? Stay aware and stay informed.
Today we are here to help in this endeavor.
Below you will find the composite urban and rural rates per case mix area for Q1 2021.
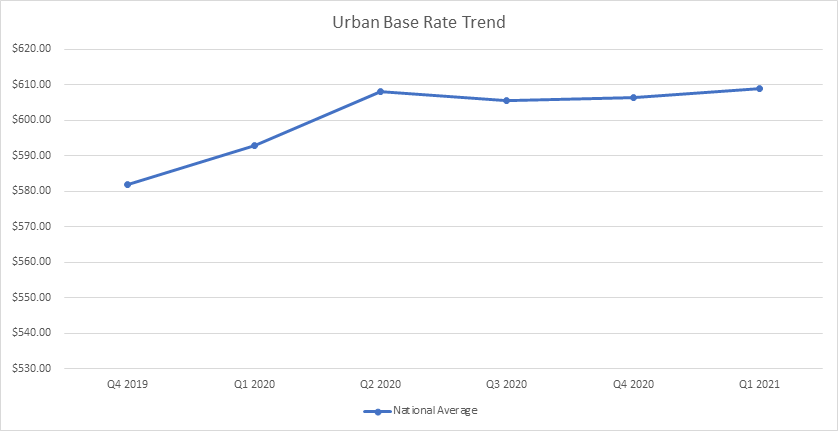
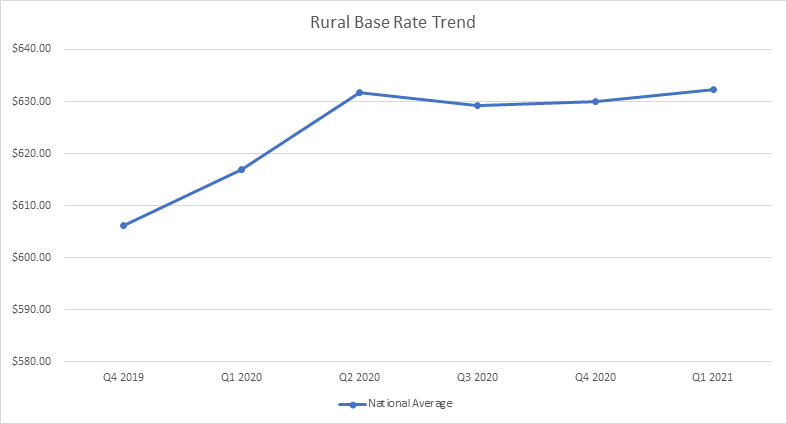
More importantly, we all need to be aware of how data has shifted and trended since the initiation of PDPM in Q4 2019.
Which areas have increased? Which have decreased?
In closing, being aware of national trends is step one.
There is also a story to be learned behind the data.
The story of your community, the story of the patients you have served and a reflection of how integrated your coding accuracy is across the interdisciplinary team.
Bear in mind as well what CMS noted in the Final Rule below:
“…we believe it is imperative that we act in a well-considered but expedient manner once excess payments are identified. Additionally, as stated earlier in this section, our analysis of FY 2020 data found that even after removing beneficiaries using a PHE-related waiver or with a COVID-19 diagnosis from our data set, the observed inadvertent increase in SNF payments since PDPM was implemented was approximately the same. We will continue to monitor all available data and take that into consideration, in combination with the feedback and recommendations received, for developing the FY 2023 SNF PPS proposed rule.”
Renee Kinder, MS, CCC-SLP, RAC-CT, is Executive Vice President of Clinical Services for Broad River Rehab and a 2019 APEX Award of Excellence winner in the Writing–Regular Departments & Columns category. Additionally, she serves as Gerontology Professional Development Manager for the American Speech Language Hearing Association’s (ASHA) gerontology special interest group, is a member of the University of Kentucky College of Medicine community faculty and is an advisor to the American Medical Association’s Relative Value Update Committee (RUC) Health Care Professionals Advisory Committee (HCPAC).
The opinions expressed in McKnight’s Long-Term Care News guest submissions are the author’s and are not necessarily those of McKnight’s Long-Term Care News or its editors.