

My youngest child is learning to read.
With a touch of creativity, that is.
She walked in last week beaming with pride, a stack of photocopied little books in hand, and exclaimed, “I can read!”
Really? I said.
Hopeful, but a little shocked because we totally checked out last year during distance learning and we are only three weeks into this school year.
She picks up the first book titled, “Sid sat.”
The first page says, “Sid sat.”
Emmy, however, reads, “There was a little boy sitting outside on a sunny day with his cat Alfred.”
I laughed a little bit uncomfortably.
One, because I don’t want to hurt her feelings but also because I was thinking this is not good. She should have at a minimum a basic understanding of how to sound out “Sid sat.”
Learning to read is a fundamental skill, and now is not the time for reading between the lines.
Similarly, therapy providers and teams need to have a fundamental understanding of how their coding practice, clinical trending and reimbursement levels compare to others in their state and across the nation.
Facts first. Reading between the lines can be incredibly risky when attempting to interpret one’s metrics.
Let’s begin with PDPM trends. How did trends shift from Q42019 to Q12020?
As we learned more about coding accuracy, interdisciplinary engagement and the change from a volume to value-based reimbursement model, one would assume that CMI metrics also shifted.
Let’s not read between the lines on this one. I will instead share some hard facts.
Beginning with Q4 2019, the national urban base rate trends are presented below:
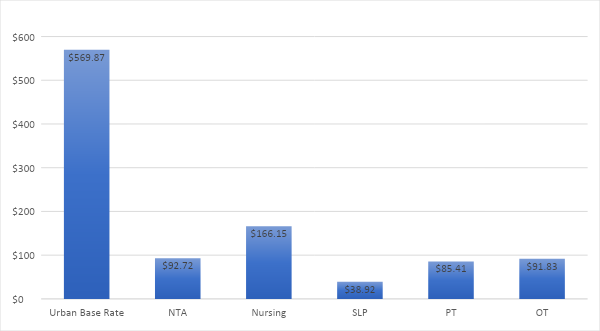
TABLE 1: Q42019 PDPM (Source: CMS ResDAC)
The next question is was there a shift in Q12020?
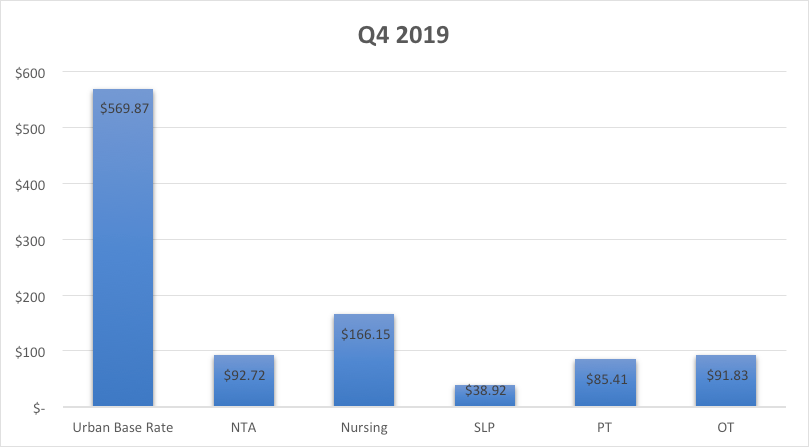
TABLE 2: Q42019 versus Q12020 PDPM (Source: CMS ResDAC)
To interpret the chart above, one must have a basic understanding of the metrics at play. I will liken this to the word level skill that Emmy needs to master. Creative reading here could be particularly hazardous.
What can we say?
We can factually say all rates increased, and that overall, the increase in nursing specifically was greater than NTA, SLP, PT or OT.
Reading between the lines to interpret what this means for your site will take a bit more skill.
Let’s begin with an overview of what caused the specific shifts in physical and occupational therapy.
Were the changes related to clinical category shifts? Section GG Self-Care and Mobility changes? Or both?
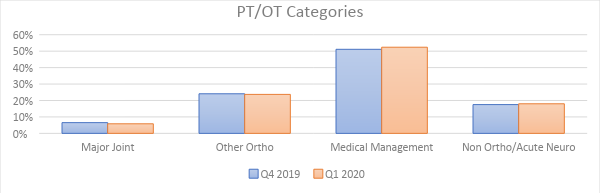
TABLE 3: Q42019 versus Q12020 PDPM PT/OT Clinical Category (Source: CMS ResDAC)
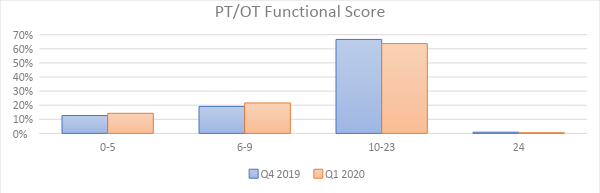
TABLE 4: Q42019 versus Q12020 PDPM PT/OT Section GG (Source: CMS ResDAC)
Now taking the view to a higher level, one may consider how trend’s varied across states.
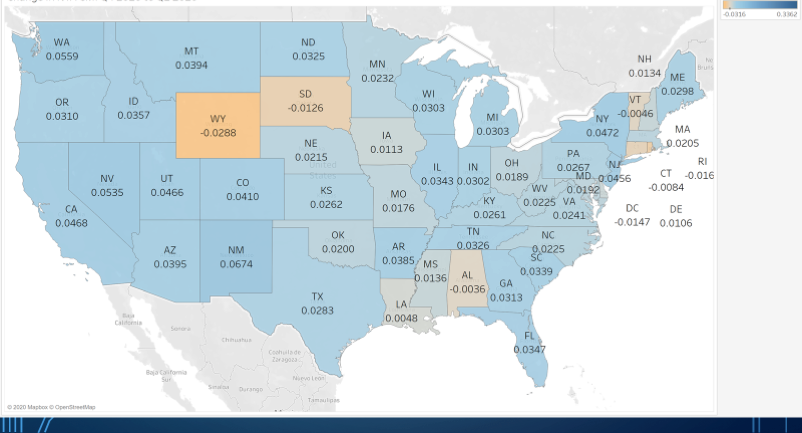
TABLE 5: Q42019 versus Q12020 PDPM National NTA (Source: CMS ResDAC)
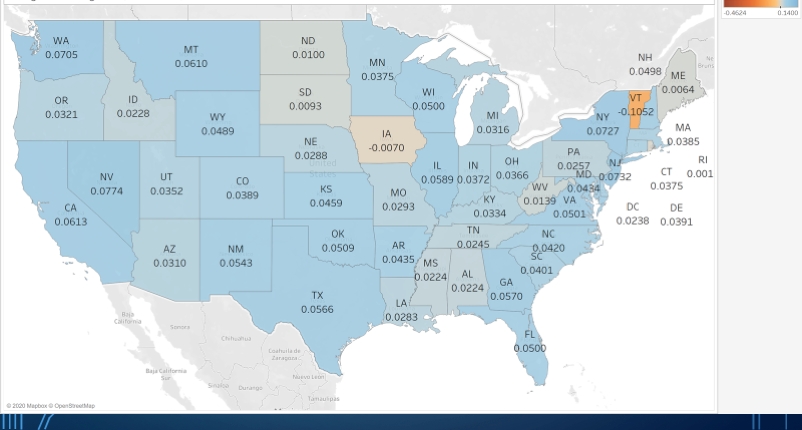
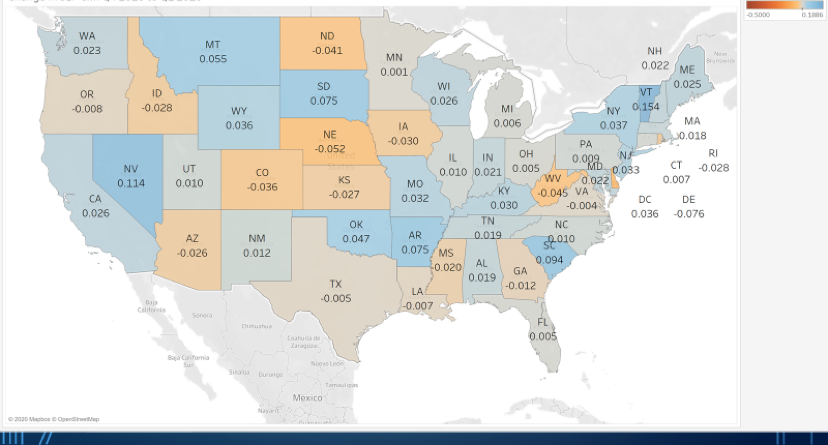
TABLE 7: Q42019 versus Q12020 PDPM National SLP (Source: CMS ResDAC)
In closing, as you can see, changes are occurring across the nation.
We must continue to enhance our skills and you all I cannot wait to see the Q22020 trends and impact of COVID-19!
Emmy is now arriving at school 30 minutes early on designated days to refine her reading skills. For her, it’s simply extra special time with a teacher she loves.
Likewise, I am hopeful the metrics shared here today will generate some special interpretation time in your sites.
Remember, mastering an understanding of data metrics like reading, takes time, takes practice, and takes a concentration to not read between the lines.
Renee Kinder, MS, CCC-SLP, RAC-CT, is Executive Vice President of Clinical Services for Broad River Rehab and a 2019 APEX Award of Excellence winner in the Writing–Regular Departments & Columns category. Additionally, she serves as Gerontology Professional Development Manager for the American Speech Language Hearing Association’s (ASHA) gerontology special interest group, is a member of the University of Kentucky College of Medicine community faculty, and is an advisor to the American Medical Association’s Relative Value Update Committee (RUC) Health Care Professionals Advisory Committee (HCPAC).