

While shopping for my first condo in 1993, I was initially drawn to new and shiny developments in an area of Boston that was “up and coming.” I visited one abode that seemed promising at first. Its clean walls and white-on-white color palette amplified the light coming through the windows. The wall-to-wall carpeting cushioned my step and felt luxurious, like proof that I’d made it in the world.
Then someone started to speak — something about a cat? — sounding like they were right next to me. When I turned, I realized I was hearing the voice of a person in the abutting condo unit, a full room and some very thin walls away. This perfect condo was nothing more than a house of cards.
Ultimately, I landed on a 100-year-old historic building that had been converted into condos. It had some flaws: The hardwood floors were beautiful but uneven, and the kitchen and bathroom were both dated. But they were easy to overlook. My first condo had good bones, and it proved to be both a welcoming home and a terrific financial investment.
Much like offerings on the housing market, a skilled nursing facility (SNF) can be a house of cards or have good bones — the best kind of “fixer upper.” Often it’s hard to discern which is which, since available SNF data can be misleading. However, that same data can also be used to predict future success and alleviate buyer’s remorse.
Too often, a SNF’s future performance bears little resemblance to its current or past performance. A SNF may presently look “good” or “bad,” but its instability drastically changes its future performance and can be an unwelcome surprise for both operators and investors. Just like a fresh coat of paint can cover up all sins, so can “managed” data.
The Facility Stability Index (FSI) was created to reduce the risk of unexpected future performance. Using a broad array of 11 tested variables, it rates a facility on its “stability” and likelihood of maintaining current performance in the near future. A facility on the brink of decline, regardless of its current performance, based upon these variables, would rate high on the FSI. Conversely, a facility, regardless of its current performance, that is rated as “stable” would have a low score.
Moving beyond the glossy marketing literature, how can you determine if you’re evaluating a house of cards or one with good bones? Consider this punch list:
- Survey performance
- Quality outcomes
- Staffing metrics
- Special Focus Facility (SFF) designation
- SFF candidate
- Abuse icon
- Occupancy change
- Administrative turnover rate
- Total nursing turnover
- Monday–Friday versus weekend staffing
- Rehospitalization rate
With few exceptions, each variable in the punch list is measured in two ways: change from beginning to end of the most recent two years, and measure movement within the same time frame. In other words, the FSI looks at actual “real” improvement or decline, and “popcorning” across two years.
The first graph shows the distribution of all U.S. SNFs on the FSI.
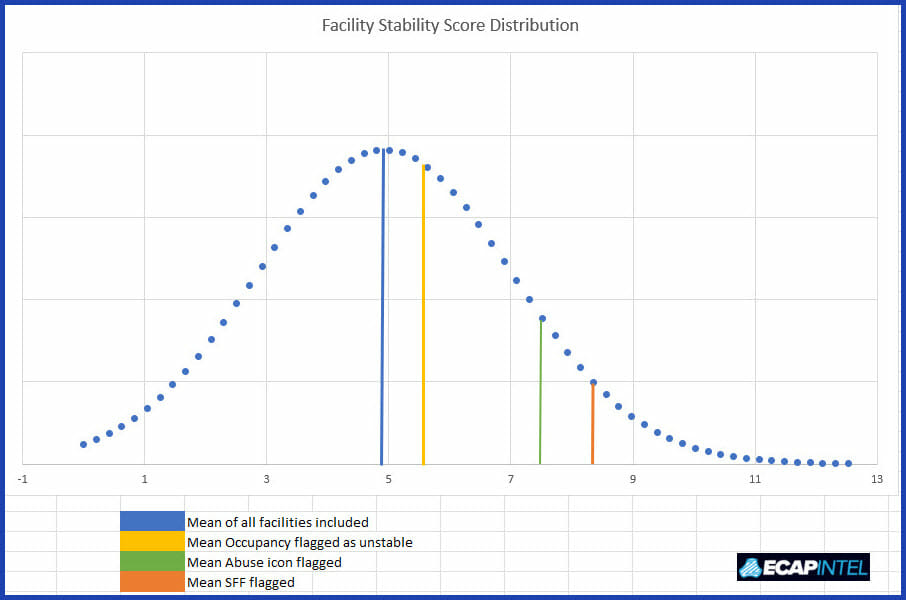
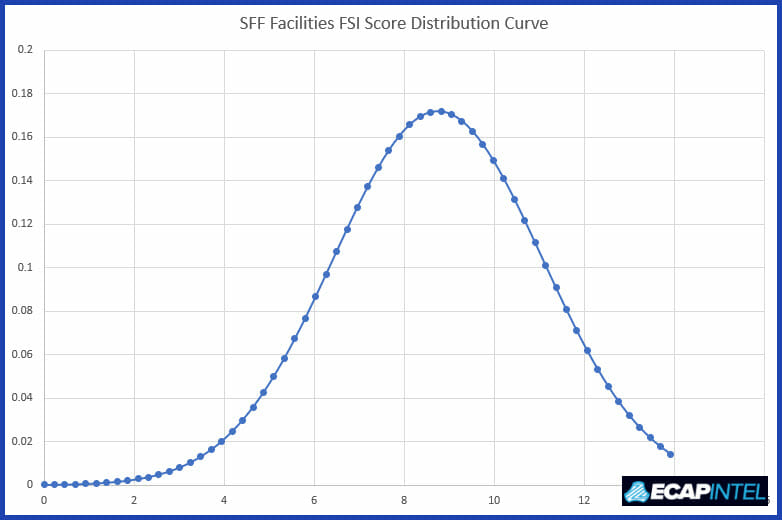
While a single variable, for example being on the SFF list, increases the average FSI score, the second graph demonstrates the clear value of the FSI. Among SFF-designated facilities, the average FSI score is 8.34 (vs. 4.93 among all facilities). However, there are SFFs at all levels of the FSI, meaning that some of them in fact have good bones, or “diamonds in the rough.”
Careful outcome measurement adds significant value when evaluating an acquisition or monitoring your current portfolio; anticipating the future is key. These variables that comprise the FSI, taken into total consideration, can lend tremendous insights.
Steven Littlehale is a gerontological clinical nurse specialist and chief innovation officer at Zimmet Healthcare Services Group.
The opinions expressed in McKnight’s Long-Term Care News guest submissions are the author’s and are not necessarily those of McKnight’s Long-Term Care News or its editors.