
Medicaid daily revenue per patient day in skilled nursing facilities rose to a record level in January, even as similar measures for Medicare retreated.
Meanwhile, occupancy continued its slow but steady climb toward pre-pandemic levels in January. There’s little disagreement that there’s plenty of work still to do there.
But just where occupancy levels actually now sit is an entirely different issue and it elicits plenty of disagreement among analysts.
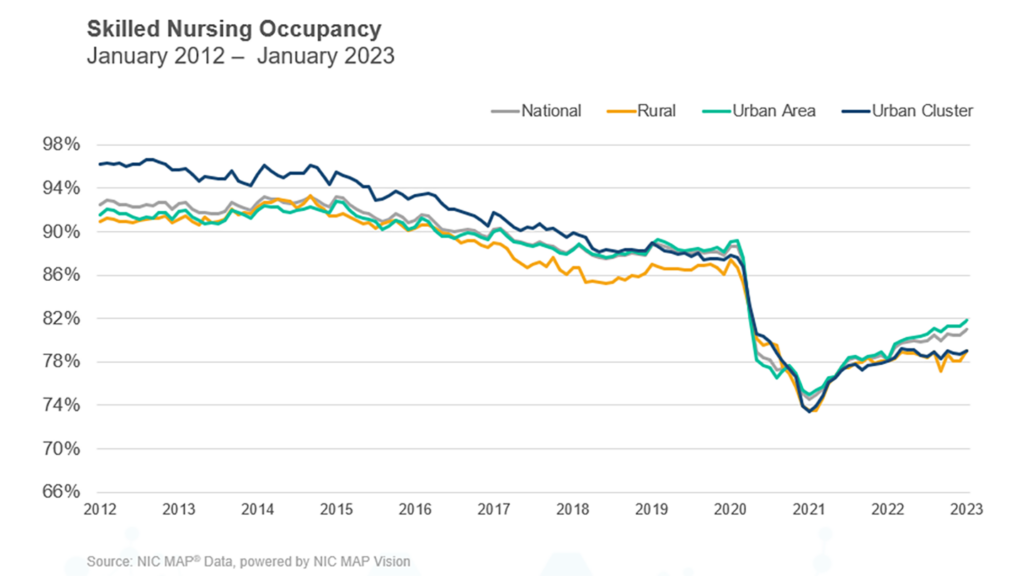
NIC MAP Vision released its latest monthly skilled nursing report Thursday, touting occupancy had risen 49 basis points from December to January. That put occupancy nationwide at an estimated 81.0%, according to a blog by NIC Senior Principal Bill Kauffman.
Those figures are based on volunteered data for 919 facilities across 39 states. They reflect a two-year rise of 643 basis points since a low point of 74.5% was recorded in January of 2021, according to NIC MAP.
Occupancy is indeed slowly trending up, agreed Marc Zimmet, CEO of Zimmet Healthcare Services Group. He maintains affiliations with the eCapIntel and Z-CORE data analytics services. But overall occupancy levels are significantly lower than many believe, he added.
Zimmet said he prefers to use a bigger sample, from the Centers for Disease Control and Prevention’s National Healthcare Safety Network database, which encompasses virtually all 15,000 federal regulated nursing facilities and covers all 50 states.
“Relative to the real world, January 2023 occupancy was 75.4%,” Zimmet said.
“The NHSN data has flaws,” he acknowledged, quickly adding that accounting for them might make occupancy look even weaker. “Many operators improperly report the number of operational beds instead of certified beds. This error removes about 55,000 beds from the occupancy calculation’s denominator. In other words, reported occupancy for Q1 2023 is 75.5%, but the real figure is closer to 72%.”
He said it’s also important to remember that “the nation has shed more than 3% of its SNF beds since 2017 and this distorts comparisons.” As a result, when totals are made “relative to a 2017 benchmark, the occupancy actually drops to 69.9%.”
“Occupancy is ticking up,” he said to McKnight’s Long-Term Care News in an email. “But if the 55,000 beds were counted correctly, actual occupancy is about 3.4% lower than (reported). SNFs have recovered 64.8% of pre-pandemic occupancy, or about 62% when factoring in the phantom beds. When you compare current occupancy to pre-covid, you must qualify it by saying there were more beds pre-pandemic so the number of patients in facilities is even lower than it seems.”
Workforce complications
Staffing shortages are still leading the drag on skilled nursing operations, especially as the acuity level of patients has risen, NIC’s Kauffman noted in his blog post. Staffing, wage growth and general inflation are the big three making it harder on operators everywhere, he added.
He reported that Medicaid revenue per patient day (RPPD) hit an “all-time high” of $269 in January. That was up 2.79% year over year, while Medicaid revenue mix in January was at 49.8%, up 91 basis points from a year earlier.
“Medicaid reimbursement has increased more than usual as many states embraced measures to increase reimbursement related to the number of COVID-19 cases throughout the pandemic, but many states have continued to increase reimbursement. Medicaid has increased 6.3% since February 2020,” Kauffman wrote. “On the other hand, covering the cost of care for Medicaid patients is still a major concern as reimbursement does not cover the cost of care in many states.”
Meanwhile, Medicare daily revenue per patient day dropped $2 in January 2023 to sit at $592. That slippage was from a 30-month high that was set in 2020 when many federal COVID-19 initiatives kicked in, Kauffman reminded.
Medicare revenue mix dropped from 23.3% to 23.1% in January, according to NIC MAP Vision data. In the other direction, managed Medicare revenue mix rose nearly a full percentage point, to 11.2%.
Managed care effects
Kauffman said managed Medicare’s very slight recent rise in daily revenue is partly responsible for continued pressure on operators’ revenue as managed Medicare’s reach continues to balloon around the country.
“However, some operators see an opportunity to capture patient volume with the growth of managed care,” Kauffman wrote. “The persistent decline in managed Medicare revenue per patient day continues to result in an expanded reimbursement differential between Medicare fee-for-service and managed Medicare. Medicare fee-for-service RPPD ended January 2023 at $592, representing a $124 difference. For context, the differential one year ago was $119 and two years ago it was $101.”